Guides for StatsAmerica
How can regional decision makers use StatsAmerica?
Introduction
StatsAmerica is built to help economic development practitioners find the data they need to make decisions regarding the well-being and economic prosperity of their communities. Practitioners can use StatsAmerica to pursue evidence-based development strategies and policies to improve their communities’ standard of living. Questions about potential development strategies can be answered by tools and data on StatsAmerica:
- Should your region pursue a business attraction strategy focused on biopharmaceutical companies? Use the Anywhere USA Profile, Counties in Profile or The Regionizer to learn more about your existing biopharmaceutical industry cluster to decide whether you have the workforce capacity to support new firms.
- Is there a vibrant startup ecosystem in your region? Use Innovation Intelligence to get a sense of the pace of startup activity and venture capital investment in your region compared to the U.S. and your peers.
- Where are the Opportunity Zones (OZs) in your region and how can you leverage their assets to encourage investment? Use the USA Opportunity Zones tool to learn about the OZs in your region, including industry and occupation mix, population and labor force data, as well as what other kinds of federal investments overlap with the OZs.
In this guide, we will consider some potential StatsAmerica use cases for regional planners, economic development professionals, community development organizations and other decision makers for whom collecting and presenting actionable data is an essential part of their work. By no means is this an exhaustive guide, rather, it’s a starting point to give you some ideas about what the data and tools can be used for and to provide some resources for making data-driven decisions with StatsAmerica.
Developing strategic plans and CEDS
For those interested in using StatsAmerica data for building their region’s Comprehensive Economic Development Strategy (CEDS), you should consult the CEDS development guide. Though that guide is focused on the CEDS, which is a required planning process and document for U.S. EDA-designated Economic Development Districts (EDDs), its guidance is also applicable to strategic planning more generally.
One of the more grunt-work intensive parts of strategic planning is gathering and manipulating data. Whether you’re working for a county or municipality, a regional commission (e.g., an EDD, metropolitan planning organization, council of governments, etc.), or a state economic development organization, StatsAmerica can help. The Anywhere USA Profile has all the “standard” geographies you may need, including municipalities, counties, tribal areas, metros and more, as well as all 380+ EDDs from the EDA. In addition, you can use The Regionizer to create your own regions by aggregating as many counties as you’d like. For most users, these tools are likely sufficient, but the StatsAmerica development team is familiar with a few special situations for which additional aggregation is needed.
Perhaps your organization’s service area includes all but one or two municipalities in a county, or you merely want to analyze data for the county minus one or two municipalities. This may be the case if a county has a single large city that can skew data for the rest of the county. Luckily, all our data can be downloaded in Microsoft Excel to allow for manipulation like this. Let’s say you work for Tarrant County, TX, and have a data analysis project where you want to exclude Fort Worth and Arlington, the two largest cities in the county, and focus on the smaller municipalities in the county.
First, navigate to Regional Profiles and download the data you need for Tarrant County. Then, download the same data for Fort Worth and Arlington separately. Finally, subtract the values for Arlington and Fort Worth from the Tarrant County total to get the values for the Tarrant County focus area. All it takes is some very basic knowledge of Excel to generate the following example of population by age.
Table 1: Calculation of population by age for Tarrant County focus area
| Population by Age, 2019 |
Tarrant County |
Fort Worth |
Arlington |
Tarrant County Partial |
Pct. of Total |
U.S. |
Pct. of Total |
| Total |
2,049,770 |
874,401 |
395,477 |
779,892 |
100% |
324,697,795 |
100% |
| Preschool (0 to 4) |
144,559 |
69,874 |
26,385 |
48,300 |
6.2% |
19,767,670 |
6.1% |
| School Age (5 to 17) |
399,085 |
172,515 |
74,765 |
151,805 |
19.5% |
53,661,722 |
16.5% |
| College Age (18 to 24) |
192,114 |
85,745 |
44,935 |
61,434 |
7.9% |
30,646,327 |
9.4% |
| Young Adult (25 to 44) |
586,762 |
264,901 |
113,911 |
207,950 |
26.7% |
86,009,246 |
26.5% |
| Adult (45 to 64) |
501,512 |
196,463 |
94,463 |
210,586 |
27.0% |
83,829,034 |
25.8% |
| Older Adult (65 plus) |
225,738 |
84,903 |
41,018 |
99,817 |
12.8% |
50,783,796 |
15.6% |
Source: StatsAmerica, from U.S. Census Bureau American Community Survey 5-year estimates
Virtually any kind of custom aggregation can be created with The Regionizer or with a few clicks and basic formulas in Excel. If you have a special circumstance that requires something more complicated, you can contact the StatsAmerica development team and we would be happy to help with your request.
Exploring innovation and entrepreneurship with Innovation Intelligence
Innovation Intelligence is an update to the popular Innovation Index that incorporates recent data, a redesigned interface, several all-new measures and more. It’s the go-to hub on StatsAmerica for data on innovation, high-tech industry clusters, foreign direct investment, entrepreneurship, broadband and much more. Not only can you use the index to get a quick and easy understanding of your region’s innovation capacity overall, for the first time, you can dig into the measures driving the index. Since releasing the Innovation Index 2.0, users have craved for the ability to see the measure data “behind the scenes” to help with their regional innovation strategies.
Perhaps an EDD or workforce development board is preparing an innovation plan for its region. It can use Innovation Intelligence to provide a baseline assessment of its innovation assets and analyze its capacity for development strategies to support innovation. For example, if it finds that its ratio of establishment births to total establishments is relatively high—a proxy for startup activity—but that these startups aren’t attracting any venture capital investment, it may want to consider how it can draw more venture capital funding to its region.
Opportunity Zones
Enacted in 2017, the federal Opportunity Zones (OZ) program is intended to foster economic development in disadvantaged areas by providing tax advantages to investments made in these areas. Communities have begun incorporating OZs into regional plans like the Comprehensive Economic Development Strategy (CEDS) and are actively marketing the zones to investors. In 2020, we partnered with the U.S. Economic Development Administration (EDA) to develop the Opportunity Zone Mapping Tool. The tool presents data about the population living in OZs and allows users to evaluate OZs in their region in the context of other federal programs, like Economic Development Districts (EDDs), University Centers and Revolving Loan Funds.
One use of the tool is for marketing the OZs in your service area to potential investors. We provide a variety of geographies to suit the needs of different audiences, including counties, congressional districts, EDDs, states and EDA regions.
Figure 1: Partial Opportunity Zone report for Tract 3 in Grand County, UT
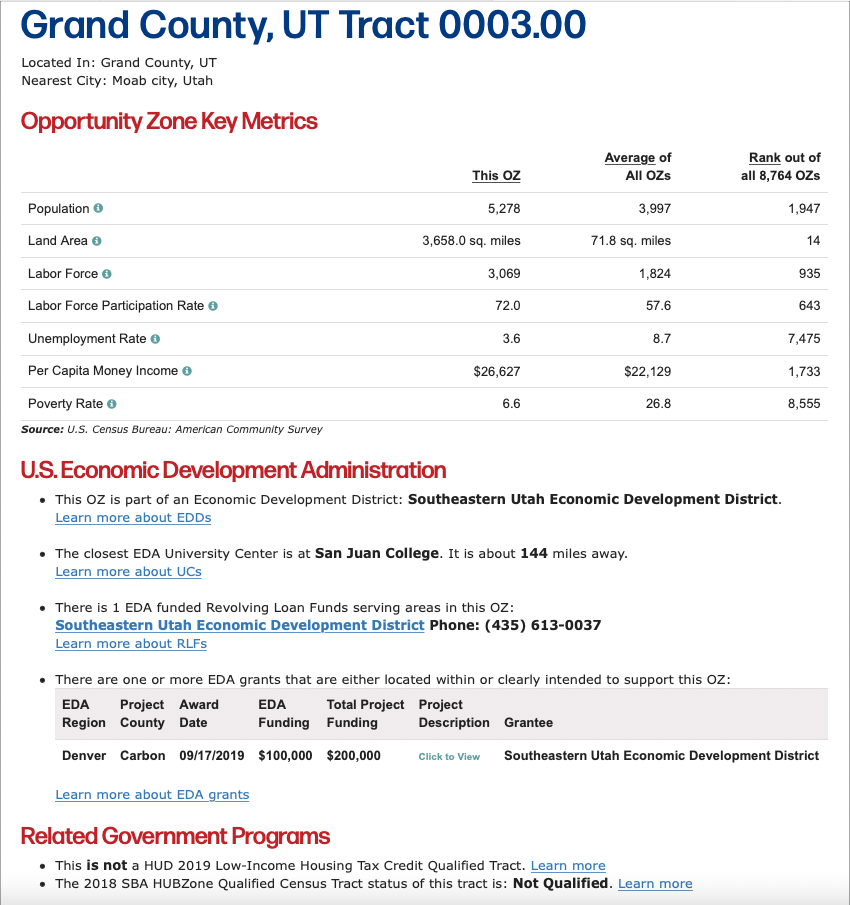
Source: USA Opportunity Zone Mapping Tool
The information in Figure 1 could be incorporated into a marketing plan for Grand County to show investors some key facts about the OZ so they can decide whether it may be a worthwhile investment. The explicit linkage between OZs and other programs at EDA and other agencies gives users an idea of the extent to which a tract has attracted federal investment or is eligible for certain kinds of government programs, which may be important for some investors. For example, a real estate investor may want to know whether the tract is qualified for low-income housing tax credits. When there is competition for investment, the intersection of OZs with other federal programs may be just the thing to tip the scales in favor of one place over another, so it’s in communities’ best interests to make would-be investors aware of these opportunities.
More resources