Guides for StatsAmerica
CEDS Development with StatsAmerica
Introduction
The Comprehensive Economic Development Strategy (CEDS) is a regionally driven economic development planning process and document for regions to identify their strengths and weaknesses and develop a plan of action to spur economic growth in their regions. The CEDS process should engage a diverse constituency, including Economic Development Districts (EDDs), community organizations, tribal communities, education institutions, public officials, the private sector and other stakeholders, to ensure equitable development strategies are pursued that help foster an environment of economic prosperity for all. You can learn more about the CEDS from the U.S. Economic Development Administration and CEDS Central, a resource from the National Association of Development Organizations.
StatsAmerica offers several tools and data sets that can help EDDs and their regional partners develop their CEDS. Of the four sections required in the CEDS (see below), StatsAmerica can be used for the summary background, the SWOT analysis, and the evaluation framework. The strategic direction/action plan should build on the data presented in the SWOT analysis, but it isn’t a data-intensive section.
The required sections of the CEDS:
- Summary Background: A summary background of the economic conditions of the region.
- SWOT Analysis: An in-depth analysis of regional strengths, weaknesses, opportunities and threats.
- Strategic Direction/Action Plan: The strategic direction and action plan should build on findings from the SWOT analysis and incorporate elements from other regional plans (e.g., land use and transportation, workforce development, etc.) where appropriate as determined by the EDD or community/region engaged in development of the CEDS. The action plan should also identify the stakeholder(s) responsible for implementation, timetables, and opportunities for the integrated use of other local, state, and federal funds.
- Evaluation Framework: Performance measures used to evaluate the organization’s implementation of the CEDS and impact on the regional economy.
Source: U.S. EDA CEDS Guidelines
What follows will walk through the three sections for which StatsAmerica is appropriate and provide use cases for CEDS development. It will also provide links to the tools and data on StatsAmerica that are most useful when building the CEDS.
Summary Background
“Data featured in the summary background section should be presented in a way that allows for clear and relevant connections to the SWOT analysis and strategic direction. For example, data analysis revealing that a region’s population is significantly older than the state or U.S. population as a whole is an important finding because it could impact workforce availability. However, it is not necessary to create multiple, detailed tables that break down population by age to prove that point—conserve space in the CEDS by moving that sort of information to an appendix.”
Source: U.S. EDA CEDS Content Guidelines, “Summary Background”
In this section, you should include baseline socioeconomic and demographic information so that a reader who is unfamiliar with your region can have an idea of the local economic conditions. The data you present should be relevant to expressing the region’s economic situation and should make clear connections to the SWOT analysis and strategic direction.
Some examples of data that can be included in the summary background, as appropriate, include:
- Demographic and socioeconomic data, including human capital assets of the area and labor force characteristics, such as educational attainment
- Environmental, geographic and cultural amenities that may affect and/or constrain the regional economy, including natural resources (e.g., mining resources, timber, etc.)
- Emerging or declining clusters or industry sectors
- Relationship of an area’s economy to that of a larger region, state or the U.S., while drawing special attention to local advantages and disadvantages
- Factors that directly impact economic performance in the area, including workforce data, innovation assets, supply chains, financial resources, transportation systems, taxes, housing, health services, as well as educational, cultural, and recreational resources
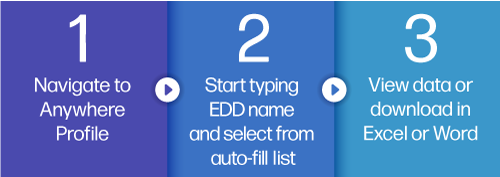
You can find background information on virtually any geography by using the Anywhere USA Profile. It is ideal for EDDs, since all 390+ EDDs are available as selectable geographies, so you don’t have to aggregate counties manually. This profile also has a comparison feature, so you can compare an EDD to its constituent counties and municipalities to identify regional advantages and disadvantages at a more granular level.
Quick Start: Gather summary background information for an EDD
Quick Start: Compare an EDD to its constituent geographies

It must be emphasized that the data you choose to present in the CEDS should be relevant to the points you want to make and clearly linked to the SWOT analysis and strategic direction. Let’s consider an example. Perhaps an EDD, the Western Arizona Economic Development District (WAEDD), is concerned about its human capital assets and is prioritizing increasing educational attainment as a strategy in the CEDS. Indeed, they decide to identify this as a weakness in the SWOT analysis. So, it is entirely appropriate to include a table, like the one below, comparing the EDDs educational attainment to that of the U.S.
Table 1: Educational Attainment for the Western Arizona Economic Development District, 2019
| Educational Attainment, 2019 |
Value |
Pct. of Total |
U.S. |
Pct. of Total |
| Total Population 25 and Older |
306,960 |
100% |
220,622,076 |
100% |
| Less Than 9th Grade |
24,802 |
8.1% |
11,284,290 |
5.1% |
| 9th to 12th, No Diploma |
36,412 |
11.9% |
15,187,971 |
6.9% |
| High School Graduate (incl. equiv.) |
95,049 |
31.0% |
59,472,748 |
27.0% |
| Some College, No Degree |
83,868 |
27.3% |
45,044,698 |
20.4% |
| Associate Degree |
24,484 |
8.0% |
18,712,207 |
8.5% |
| Bachelor's Degree |
27,304 |
8.9% |
43,646,104 |
19.8% |
| Graduate or Professional Degree |
15,041 |
4.9% |
27,274,058 |
12.4% |
Source: StatsAmerica Anywhere Profile
You can clearly see that the WAEDD lags the U.S. for bachelor’s and advanced degree attainment, which presents a challenge as college degrees become even more necessary for high-quality jobs. The WAEDD may also want to highlight how the percentage of the population who has attended college but not been awarded a degree is higher than the U.S. and may want to consider strategies to promote college retention.
SWOT Analysis
“A SWOT analysis identifies the region’s competitive advantages—those indigenous assets that make the region special or competitive in the national and global economies—juxtaposed against those internal or external factors that can keep a region from realizing its potential.”
Source: U.S. EDA CEDS Content Guidelines, “SWOT Analysis”
The SWOT analysis (strengths, weaknesses, opportunities and threats) should answer the question, “Where are we now?” by using the relevant data from the summary background to identify the factors that reflect the region’s unique assets and relative competitive advantages (strengths) and disadvantages (weaknesses). The SWOT analysis should state a clear objective with the recognition that what the region can realistically achieve is constrained by its capabilities and capacity.
You can use data on StatsAmerica to help identify your region’s strengths and weaknesses and consider how they may present opportunities and threats. Using comparisons to other regions or the U.S. is one way to get a good idea of your region’s strengths and weaknesses.
Quick Start: Compare two or more regions using the Anywhere USA Profile

To start, you can compare your region to the U.S. The Anywhere USA Profile includes a comparison to the U.S. for virtually all data points—see above for the example from WAEDD. Before, we identified the lagging educational attainment compared to the U.S. as one of the region’s weaknesses. We can compare these same data to peer EDDs to potentially reveal some nuance to the region’s human capital assets.
Table 2: Educational Attainment for WAEDD and Peer EDDs, 2019
| Educational Attainment, 2019 |
Western Arizona Economic Development District |
% |
Northern Arizona Council of Governments |
% |
Five County Association of Governments |
% |
| Population 25 and Older |
306,960 |
|
373,769 |
|
148,105 |
|
| Less Than 9th Grade |
24,802 |
8.1% |
15,412 |
4.1% |
3,218 |
2.2% |
| 9th to 12th, No Diploma |
36,412 |
11.9% |
28,676 |
7.7% |
7,461 |
5.0% |
| High School Graduate (incl. equiv.) |
95,049 |
31.0% |
99,461 |
26.6% |
35,402 |
23.9% |
| Some College, No Degree |
83,868 |
27.3% |
105,772 |
28.3% |
43,133 |
29.1% |
| Associate Degree |
24,484 |
8.0% |
32,778 |
8.8% |
17,077 |
11.5% |
| Bachelor's Degree |
27,304 |
8.9% |
53,064 |
14.2% |
26,478 |
17.9% |
| Graduate or Professional |
15,041 |
4.9% |
38,606 |
10.3% |
15,336 |
10.4% |
Source: StatsAmerica Anywhere USA Profile
WAEDD may want to compare itself to two nearby EDDs, the Northern Arizona Council of Governments and the Five County Association of Governments (Utah), to get a better sense of the extent to which its educational attainment is a strength or weakness relative to peer EDDs. Indeed, compared to its peers, WAEDD is still lagging in educational attainment.
It should be emphasized that data alone can’t identify all strengths and weaknesses. To adequately execute the SWOT analysis, those working on it must have on-the-ground knowledge and engage their regional partners to reach consensus on their strengths and weaknesses, as well as the opportunities and threats they face. StatsAmerica—for now, at least—cannot tell you about, for example, your region’s unique natural amenities or resources, or its geographic features that may be advantageous or deleterious to economic prosperity. That said, StatsAmerica can still be a valuable resource to help with developing your CEDS or other regional strategic plan.
Evaluation Framework
“The evaluation framework is an important element of the ongoing planning process and should answer the questions ‘How are we doing?’ and ‘What can we do better?’ The evaluation framework, with its associated measures and timelines, should cascade from the strategic direction and action plan, which, in turn, flow from the SWOT analysis.”
Source: U.S. EDA CEDS Content Guidelines, “Evaluation Framework”
This section is about identifying performance measures used to gauge how your region is implementing the strategies laid out in the CEDS and whether it is meeting its stated vision, goals, and objectives. EDA recommends that EDDs should seek out “traditional” and “non-traditional” performance measures when evaluating its progress. Traditional performance measures include jobs created and/or retained, private investment dollars, etc., while non-traditional measures include wealth creation (like per capita GDP growth), per capita income growth, employment growth, wages and salary growth, etc. Many of the non-traditional performance measures can be found across StatsAmerica.
The Anywhere USA Profile contains measures such as per capita income growth, median household income growth, population growth, labor force growth, and others that can be used as performance measures. It would be wise to capture these for the initial CEDS document, then monitor how economic conditions have changed each subsequent year for the required CEDS Annual Performance Report.
More resources for CEDS