The spread of natural decrease across U.S. counties
April 2026
What is natural decrease — and why does it matter?
For most of U.S. history, births outnumbered deaths in most counties. In the 2020s, that arithmetic is changing. When deaths exceed births in a geographic area, we call it natural decrease — a demographic threshold that signals a structural shift in a community’s long-term trajectory.
If a county has a natural decrease, it doesn’t mean it’s necessarily shrinking. In-migration (domestic or international) can offset it. But a county that relies entirely on newcomers to sustain its population faces a fundamentally different planning challenge than one where natural growth is doing some of that work.
The U.S. Census Bureau’s Components of Population Change dataset, available on StatsAmerica’s Download Center, breaks total population change into its drivers:
Total change = (births – deaths) + net domestic migration + net international migration
When births − deaths turns negative, it’s a natural decrease. This spotlight tracks how many U.S. counties have had natural decreases, and how quickly that number has grown since 2010.
Where natural decrease is happening now
Figure 1: County-level natural decrease, 2024-2025
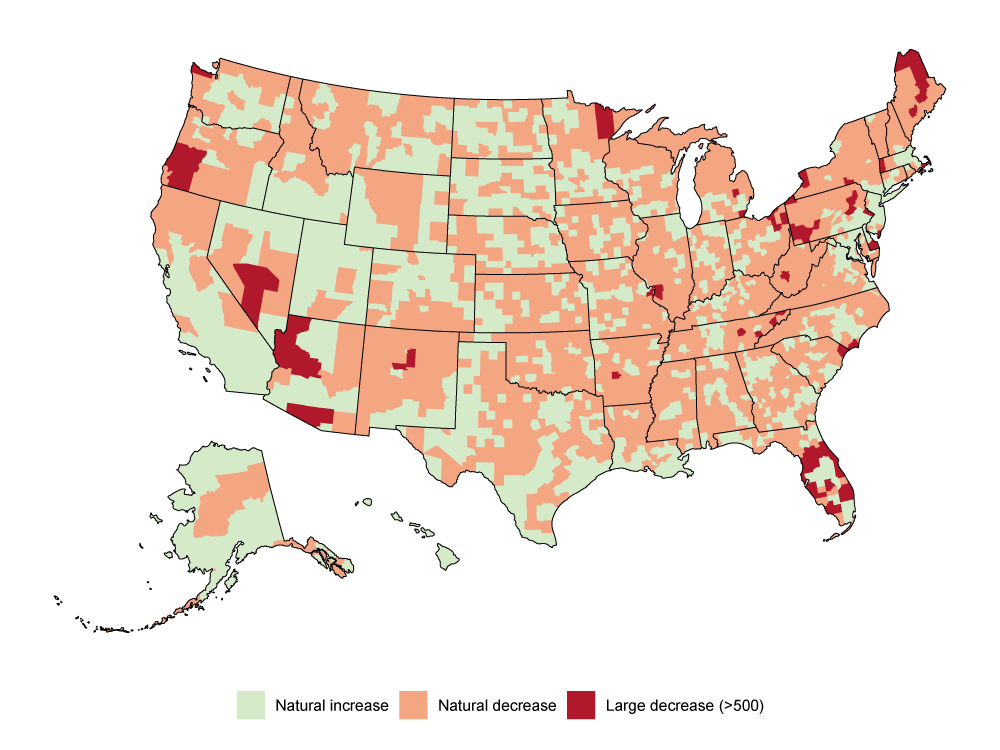
Source: Census Bureau Components of Population Change via StatsAmerica.org
The map reveals a geographic pattern: natural decrease is concentrated in rural areas, Appalachia, the Northeast, some parts of Central Florida and much of the Upper Midwest. These are places where an older age structure means more deaths, while younger adults have moved elsewhere. Some Sun Belt metros and fast-growing suburban counties remain the notable exceptions; their natural increase is supported by younger populations and higher birth rates.
A national trend accelerating since 2010
Figure 2: Share of U.S. counties in natural decrease, 2010 – present
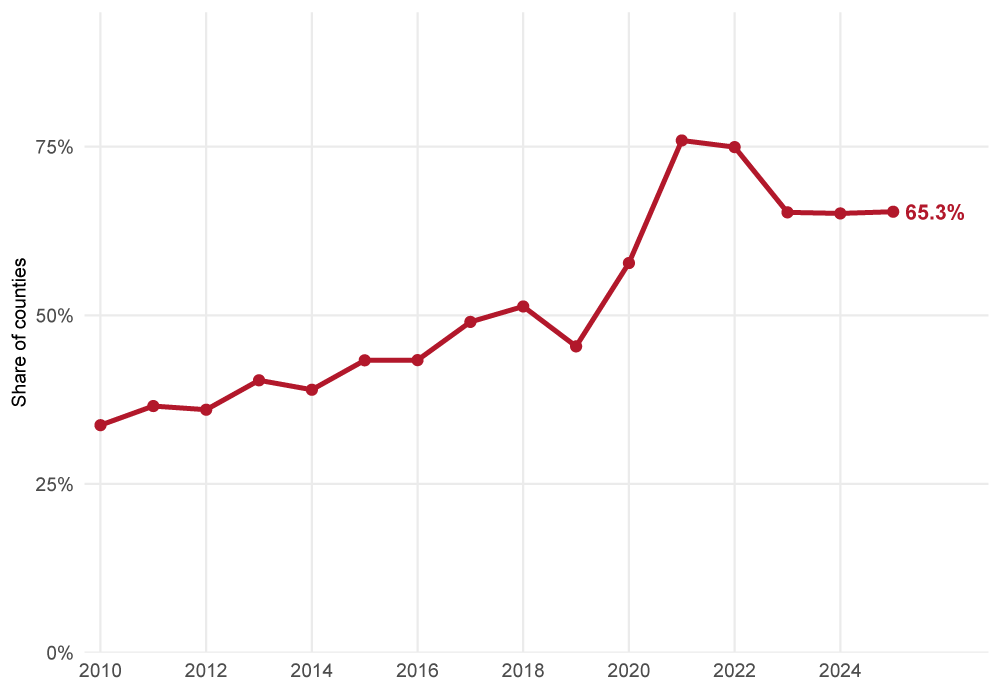
Source: Census Bureau Components of Population Change via StatsAmerica.org
The share of U.S. counties experiencing natural decrease has grown steadily since 2010, with a pronounced jump in 2020 and 2021 driven in part by COVID-19 mortality. Even as pandemic effects have moderated, the share has not returned to pre-2020 levels, reflecting the underlying demographic reality of an aging population.
State-level share of counties in natural decrease
Figure 3: Share of counties in natural decrease by state, 2025, top-20 states only
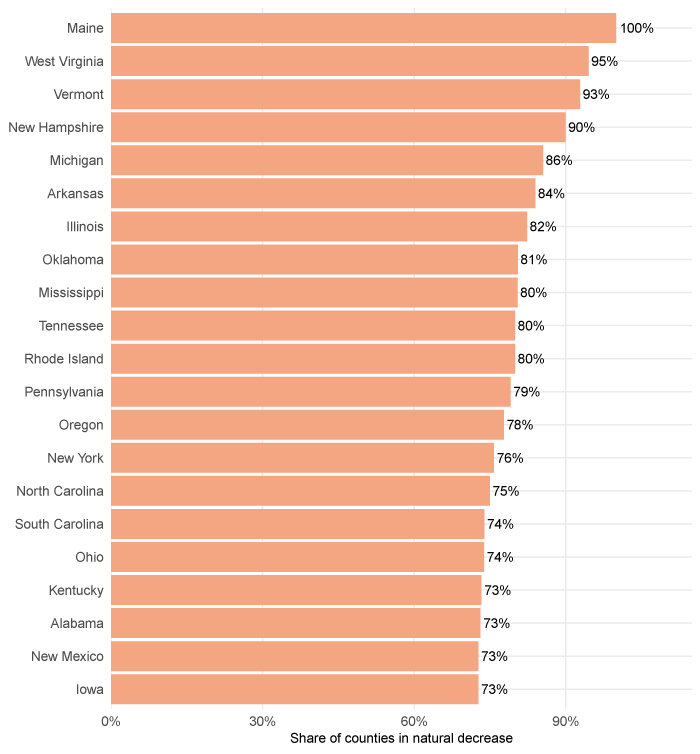
Source: Census Bureau Components of Population Change via StatsAmerica.org
Several Northeast and Rust Belt states rank among those with the highest shares of naturally decreasing counties. Rural counties in these states tend to have older age structures — a legacy of decades of out-migration by younger adults — and lower birth rates, leaving them heavily dependent on in-migration to sustain their populations.
Midwest trends over time
Figure 4: Share of counties in natural decrease, selected Midwest states, 2010 – present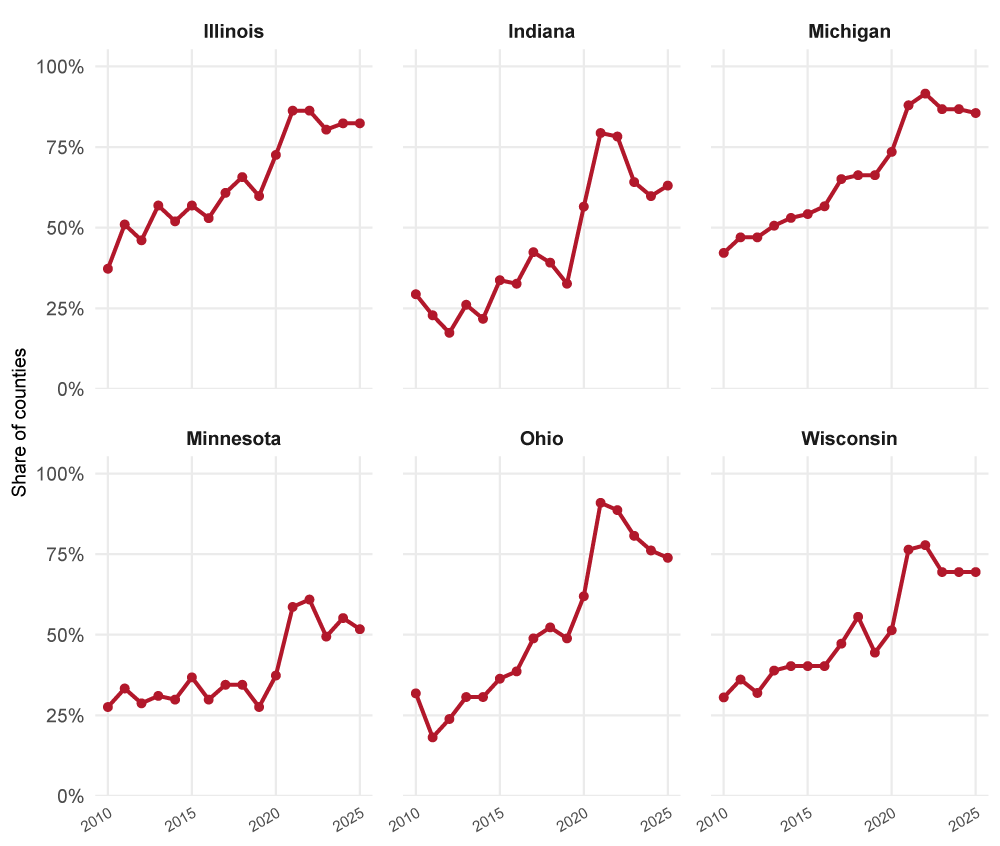
Source: Census Bureau Components of Population Change via StatsAmerica.org
All the Midwest states in the comparison above have 50% or more of their counties experiencing a natural decrease in 2025. Minnesota has the lowest share at around 50%, while Michigan has the highest at 86%. In all cases, 2020–2021 stands out as an inflection point, with shares rising sharply before stabilizing — though no state has returned to its pre-pandemic level.
What to watch for
-
Natural decrease ≠ population decline. A county experiencing natural decrease can still grow if migration is strong enough. The economic development question is: How sustainable is that reliance on in-migration?
-
Urban/rural split matters. Natural decrease is more prevalent in rural areas. Metro-area counties with younger populations and higher birth rates remain largely insulated, though their surrounding rural counties often are not.
-
Pandemic effects versus long-run trends. The 2020–2021 spike in natural decrease reflected elevated mortality. However, the underlying trend toward more counties experiencing natural decrease predates the pandemic and is expected to continue as baby boomers age further into their retirement years.
-
Intercensal adjustments. Sharp movements in census-year data reflect statistical adjustments, not actual demographic swings. Year-to-year comparisons within a decade are more reliable than comparisons across census years.
Data: Census Bureau Components of Population Change, accessed via StatsAmerica’s Download Center. Analysis covers counties with available data from 2010 to 2025.