Between 2010 and 2024, nearly every U.S. state saw its working-age population share decline as the Baby Boom generation aged into retirement. But the pace and magnitude of this shift varies dramatically across states — with major implications for workforce capacity, economic growth, and regional competitiveness.
Understanding these age structure trends is critical for economic development planning. A shrinking working-age population share signals potential labor force constraints, while rapid growth in the 65+ population brings challenges, such as increased health care demand and fiscal pressures.
How to conduct this analysis
This analysis uses publicly available data from the Census Bureau accessed via StatsAmerica’s Download Center. To recreate or adapt this analysis for your region:
- Visit the StatsAmerica Download Center
- Under the “Population” section, download Population by Age and Sex
- Open the file “Population by Age and Sex - US, States, Counties.csv”
- Filter to your desired geography and time period
- Calculate age group shares by dividing each age cohort by total population
- Compare across time periods or regions
The dataset contains annual estimates from 2000-2024 for states, counties, metros, micros, and EDDs, broken into standard age bands (0-4, 5-17, 18-24, 25-44, 45-64, 65+). For this analysis, we combined the 25-44 and 45-64 bands to create a “working-age” measure and examined state-level changes from 2010 to 2024.
Pro tip: Tools like Excel, R, or Python can help automate calculations across multiple geographies. For a quick check of your region, you can manually calculate: (Population 25-44 + Population 45-64) ÷ Total Population × 100 = Working-age share (%).
The near-universal aging trend
Our analysis reveals a striking national pattern: 49 of the 50 states saw their working-age share decline from 2010 to 2024. Only Utah and the District of Columbia bucked this trend, with modest gains of 1.1 and 1.0 percentage points respectively. The map below shows the magnitude of change.
Figure 1: Percentage point change in the share of the population aged 25-64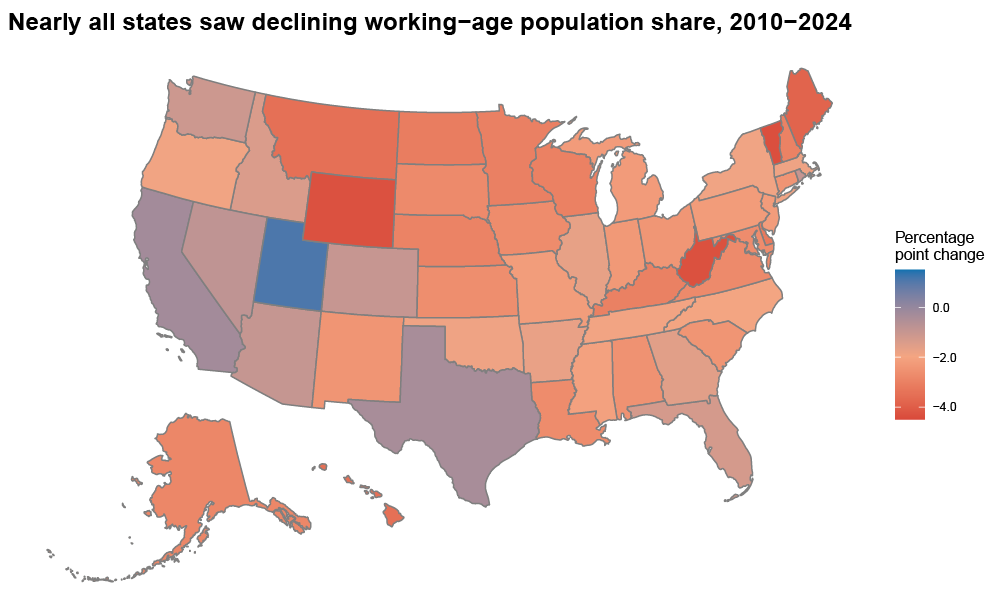
Source: Census Bureau Population Estimates via StatsAmerica
The states experiencing the steepest declines — Vermont (-4.4 percentage points), West Virginia (-4.3), and Wyoming (-4.3) — face particularly acute workforce challenges. These losses represent not just demographic shifts but potential constraints on economic growth and business attraction.
Meanwhile, the median state lost 2.4 percentage points of working-age share, equivalent to roughly 100,000 fewer working-age residents in a state of 4 million people.
Diverging demographic destinies
While the trend is nearly universal, the trajectories differ sharply. The chart below compares six states representing the spectrum of age structure change.
Figure 2: Share of the population that is working age and senior in six states from 2010 to 2024
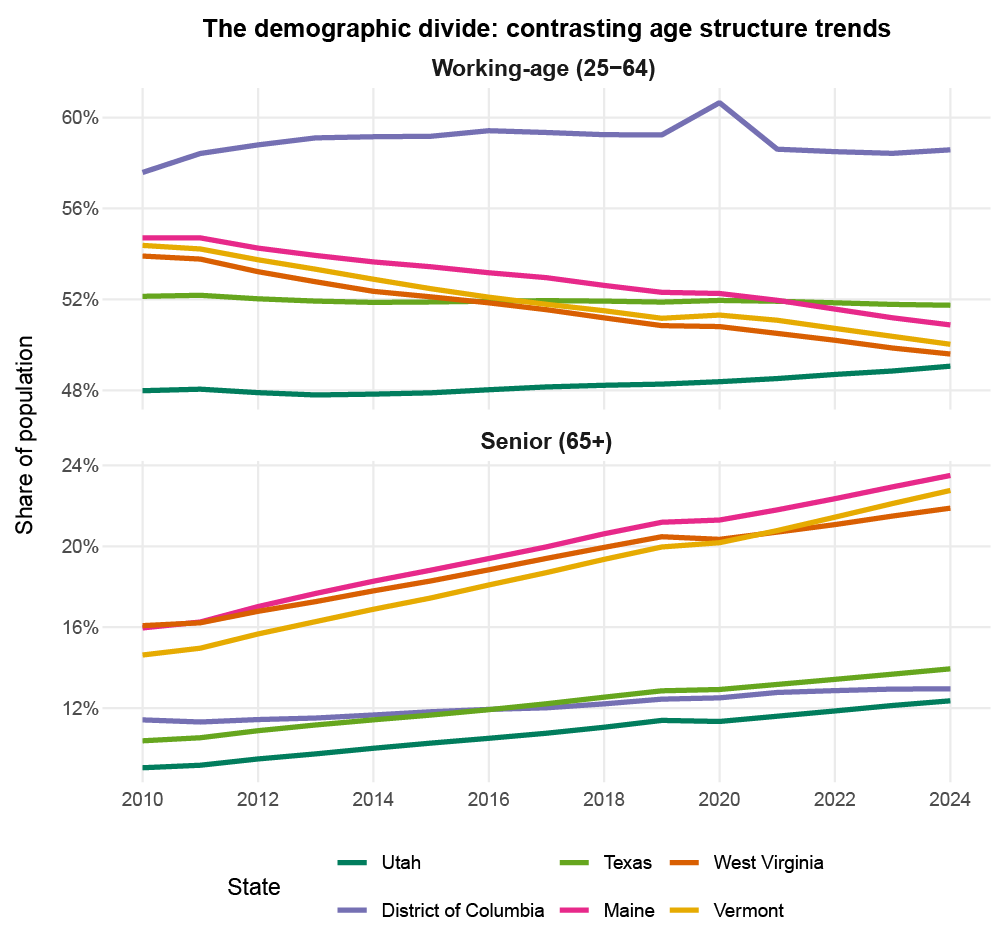
Note: Y−axis scales differ between panels.
Source: Census Bureau Population Estimates via StatsAmerica
States with the least working-age decline:
- Utah stands nearly alone, with continued population growth among families and young adults offsetting aging trends.
- District of Columbia attracts young professionals, while fewer families mean less aging-in-place.
- Texas benefits from strong domestic in-migration of working-age adults.
States with the most rapid aging:
- Vermont faces a perfect storm: limited in-migration, aging Baby Boomers, and youth outmigration.
- West Virginia and Maine share similar challenges with rural character and limited economic opportunities for younger workers.
Notice the mirror image in the senior population panel: states losing working-age share are simultaneously seeing the fastest growth in their 65+ populations. Vermont’s senior share jumped 8.1 percentage points (from 14.6% to 22.7%), while DC’s grew just 1.5 points.
Why it matters for economic development
These age structure shifts carry profound implications:
- Workforce planning and attraction: States with declining working-age shares face tighter labor markets, making workforce availability a key selling point — or liability — in business attraction efforts. Strategies may need to emphasize upskilling older workers, investing in families, attracting remote workers, or promoting in-migration.
- Infrastructure and service demands: Rapidly aging states need different public investments than younger ones, like more health care facilities and senior services. Economic development strategies must align with these demographic realities.
- Fiscal sustainability: Working-age populations generate tax revenue, while seniors consume services. States with shrinking workforce shares may face budget pressures that constrain their ability to invest in economic development.
- Business composition: Age structure shapes market opportunities. States with growing senior populations may see expansion in health care, financial services, and leisure industries, while those retaining working-age populations can support broader industrial mixes.
- Long-term competitiveness: Demographic momentum matters. Today’s age structure predicts tomorrow’s workforce availability, and regions that fall behind may struggle to catch up.
Using this data in your work
The Census Bureau’s Population by Age and Sex dataset, available on StatsAmerica’s Download Center, breaks down population into key age cohorts. This dataset enables several practical analyses:
- Benchmark your region: Compare your state or metro area’s age structure trends against peer regions.
- Project workforce availability: Use age cohort data to forecast labor force changes.
- Target attraction strategies: Identify which age groups your region is gaining or losing.
- Support grant applications: Demonstrate workforce needs or document demographic challenges.
- Inform strategic planning: Ground your CEDS or economic development strategy in demographic reality.
These trends aren’t destiny, but they do define the context for economic development work in the coming decade. Understanding where your region stands is the first step toward proactive response.
Data source: U.S. Census Bureau Population Estimates by Age and Sex, accessed via StatsAmerica Download Center