Measuring Distress is a simple tool for finding the unemployment rate and per capita income for communities across the United States. When it was developed, its primary purpose was to determine whether communities met income or unemployment thresholds for certain federal grants. But it can also be used more generally to understand an area’s level of distress – as measured by its unemployment rate and per capita income – relative to other areas, including counties and census tracts.
What are census tracts?
One of Measuring Distress’s most notable features is its ability to micro-target an area not only at the county level but at the census tract level. The census tract is a small geographic area located within counties (or county equivalents) used by the U.S. Census Bureau to collect and analyze data about communities. In urban areas especially, census tracts are often considered to represent neighborhoods.
But the power of census tracts is that they are designed to have roughly the same population, regardless of whether the tract is in an urban area, so that comparisons between different areas can be fair and meaningful. Generally, census tracts have populations of between 2,500 and 8,000 residents and have boundaries that follow visible features.
Where do you get data at the census tract level?
The U.S. Census Bureau American Community Survey (ACS) is the best source for data at the census tract level; indeed, it’s where we get the per capita income and unemployment data for Measuring Distress. On the U.S. Census Bureau’s flagship data site, data.census.gov, you can find data at the census tract or even the census block group level, which is the most granular level of geography for which data is available from federal statistical agencies.
StatsAmerica doesn’t offer data at the block group level and has limited data available at the census tract level. This is partly due to the reduced precision of estimates at such granular geographies; the smaller the area, the higher the margin of error for any data point. So, one must use caution when reporting data at the census tract or block group level.
Tutorial: Using Measuring Distress to understand economic strain at the neighborhood level
Navigate to Measuring Distress and click “Tract Tool” to access the tract features. You will be presented with a map of the United States and are able to select tracts in two ways: (1) by holding down shift while dragging your mouse over the map or (2) choosing tracts from a dropdown list. Using both selection mechanisms in tandem is often the way to go to get the tracts you need.
Perhaps you want to select some tracts in Omaha, Nebraska to see which neighborhoods are struggling when it comes to high unemployment and low per capita income. Zoom into Omaha, hold the shift key and drag your mouse to select the tracts in Omaha and click “Get Data.”
Figure 1: Selecting tracts with the map selection in Omaha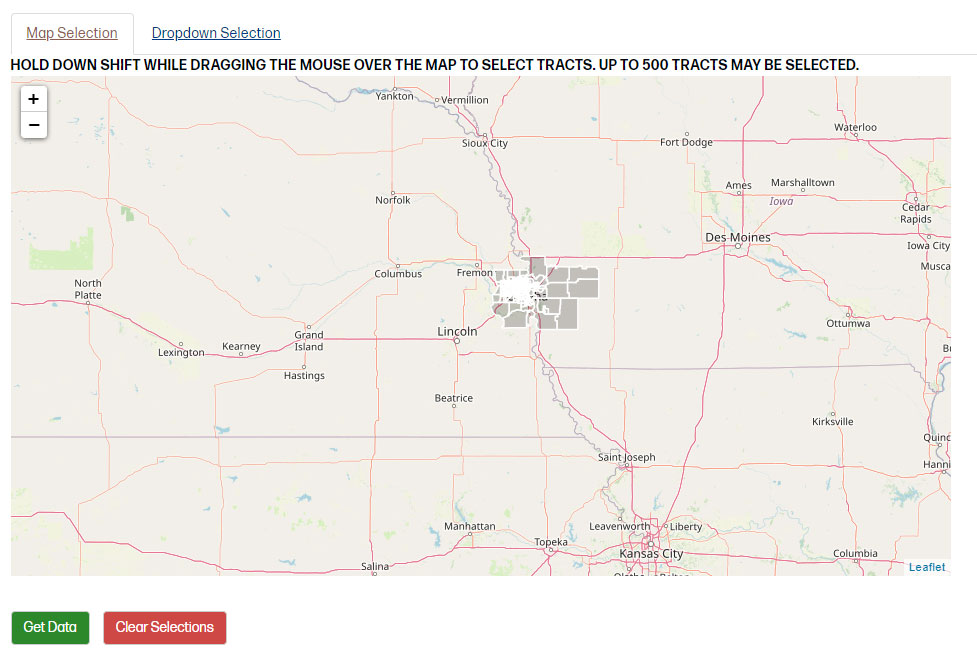
Because Omaha is a (relatively) dense area, it selects dozens of tracts, some of which you may not want. So, switch over to the dropdown selection to confirm you only selected the tracts you want.
Figure 2: Selected tracts in the dropdown selection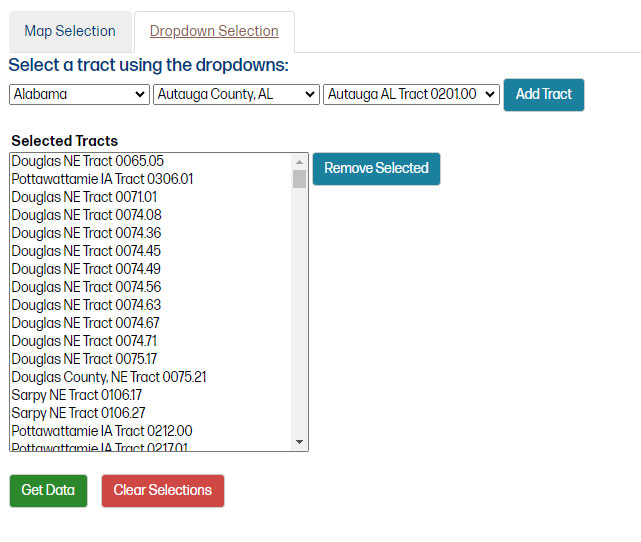
Omaha is in Douglas County, so, right off the bat, we know that we selected more than we needed. Hold control/command, click the tracts not in Douglas County, and click “Remove Selected” to remove them. You can also manually add more tracts in Douglas County using the dropdowns: Select “Nebraska”, then “Douglas County, NE”, select the tracts you want in the third dropdown box and click “Add Tract” to further refine the list of tracts. Once you’re satisfied with the list of tracts in the “Selected Tracts” box, click “Get Data.”
From here, you can view the unemployment rates and per capita money income for the region you selected as a whole, the United States, and each of the individual tracts. The threshold calculation columns compare the data for your selection to the United States; if the threshold calculation for the unemployment rate is 0.9, it means the unemployment rate for the tract/region is 0.9 percentage points greater than the U.S. unemployment rate.
Figure 3: Partial table of unemployment rates and per capita money income for tracts in Douglas County, NE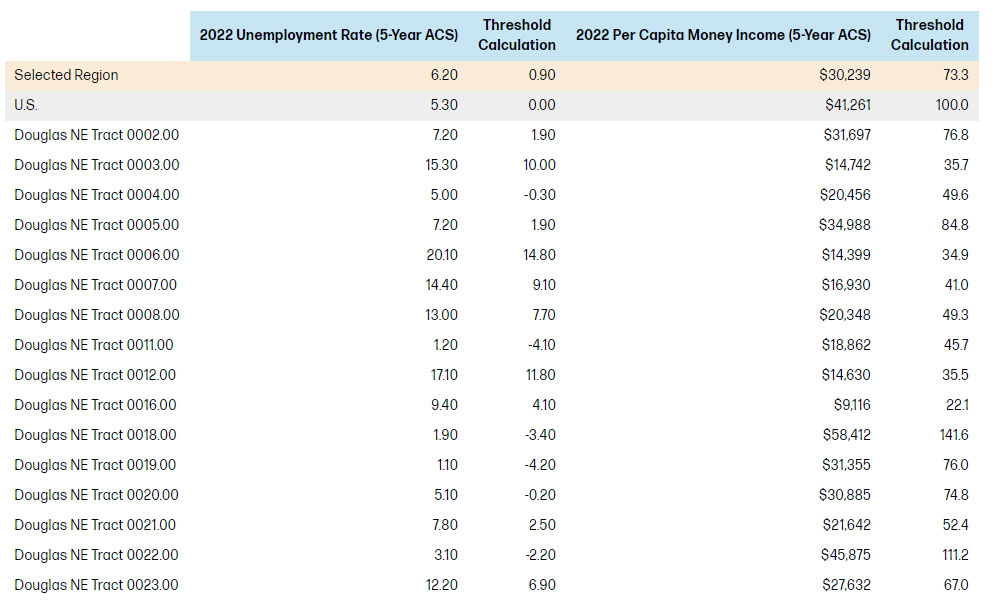
Compared to the U.S., the region and many of the tracts comprising it are not doing so well. Overall, the unemployment rate is 0.9 percentage points higher than the U.S. and the per capita money income is 73% that of the U.S. in 2022. Many of the tracts have unemployment higher than 10% and one (0016.00) has a per capita money income one-fifth as high as the U.S.
Though we don’t report the margins of error, it bears repeating that, since these are small geographies, the margins of error are likely elevated so one must use caution with these data. Nonetheless, it’s important to understand the wide variance of distress indicators within counties and the Measuring Distress tract tool is a simple and powerful way to do so.