Using Innovation Intelligence to understand a region’s innovation capacity and outcomes
April 2024
Innovation Intelligence (II3) lets you explore a variety of regional characteristics related to innovation and entrepreneurship. It does this by synthesizing dozens of indicators into a headline Innovation Index and five core indexes. It includes both innovation inputs and outputs to measure both innovation capacity — a region’s potential for innovation — and innovation outcomes.
Stakeholders, from local and regional governments to business owners, should be interested in both aspects. High innovation capacity means the region has a skilled workforce and a business environment that may be conducive to innovation and entrepreneurship. A high level of innovation outcomes, like patents, venture capital funding, business creation and the like, shows the region has “proven it” and likely already has a strong entrepreneurial ecosystem.
The core indexes are organized around topics. The measures in the Business Dynamics and Business Profile core indexes are primarily outcomes-based; Employment and Productivity measures are about evenly split; and the other two are mostly or all capacity-based. See Table 1 for examples of some capacity and outcomes measures.
Table 1: Examples of innovation capacity and outcomes measures by core index
| Core index |
Measure |
Type |
| Human Capital & Knowledge Creation |
Average STEM degree creation |
Capacity |
| Patent technology diffusion |
Outcome |
| Business Dynamics |
Average small establishments per worker |
Capacity |
| Establishment births to all establishments ratio |
Outcome |
| Business Profile |
Farm operators with internet access |
Capacity |
| Average annual venture capital |
Outcome |
| Employment & Productivity |
Average gross domestic product per worker |
Capacity |
| Change in average patenting rate |
Outcome |
| Economic Well-Being* |
Per capita personal income growth |
Capacity |
| Average poverty rate |
Capacity |
* Economic Well-Being does not contain any outcomes-based measures.
You can explore both kinds of measures in tandem to help you understand how a region has performed in terms of promoting an environment of innovation and entrepreneurship (capacity) and how individuals and businesses are capitalizing on that environment to start businesses, attract venture capital investment and patent new ideas (outcomes). To see this in action, Table 2 digs into the indexes of two metro areas: Burlington, Vermont, and Nashville, Tennessee.
Table 2: Index values and ranks for the Nashville and Burlington metro areas
| Index |
Nashville, TN |
Burlington, VT |
| Headline Innovation Index |
144.4 (rank: 11) |
134.2 (64) |
| Human Capital & Knowledge Creation |
139.8 (48) |
140.2 (46) |
| Business Dynamics |
155.2 (80) |
122.6 (247) |
| Business Profile |
142.1 (7) |
123.0 (65) |
| Employment & Productivity |
130.6 (48) |
127.3 (104) |
| Economic Well-Being |
154.4 (20) |
158.0 (12) |
Note: There are 383 metropolitan statistical areas in the United States.
The metros are similar across the two core indexes that are more capacity-heavy, Human Capital & Knowledge Creation and Economic Well-Being. But Burlington lags Nashville substantially among the other, more outcomes-focused core indexes, Business Dynamics, Business Profile and Employment & Productivity, as well as the headline index. Though Burlington and Nashville both have high standards of living and a well-educated workforce, Nashville has shown it has a superior business environment.
Nashville is capitalizing on its innovation capacity in a way that Burlington is not: attracting more venture capital and foreign direct investment and encouraging business formation and expansion. Table 3 compares a few measures from the Business Dynamics and Business Profile core indexes. Note that the measures are indexed for easier comparison and that 50 is the minimum value and 200 is the maximum value.
Table 3: Comparison of selected Business Profile and Business Dynamics measures
| Measure |
Nashville, TN |
Burlington, VT |
Median metro |
| Business Profile |
| Change in average VC deals |
113.6 |
106.9 |
103.6 |
| Change in average VC$ |
120.0 |
118.6 |
50 |
| FDI employment ratio, domestic source |
200.0 |
108.9 |
113.2 |
| FDI employment ratio, foreign source |
122.2 |
109.5 |
111.7 |
| Proprietor income to total wages and salaries ratio |
199.0 |
121.4 |
119.0 |
| Business Dynamics |
| Establishment births to all establishments ratio |
185.5 |
120.4 |
140.3 |
| Traded sector establishment births to all establishments ratio |
181.9 |
149.7 |
151.7 |
| Jobs attributed to establishment births to total employment ratio |
172.3 |
108.6 |
127.8 |
| Establishment expansions to contractions ratio |
152.5 |
110.4 |
126.7 |
| Establishment births to deaths ratio |
185.6 |
116.8 |
136.1 |
Note: For more information about these measures, see the documentation file.
Because it has an index of 200 for the domestic source FDI employment ratio, for example, Nashville has the highest value of all metros for this measure, defined as the ratio of employment created by new, U.S.-sourced investment to the working-age population (ages 18 to 66). This indicates the region is among the most attractive to U.S.-based business investment, and that it’s resulted in significant job creation. Contrast this with Burlington, however, which is much less attractive to this investment, with a value lower than the median metro.
What does all this mean and how can you apply it to your own region? One approach is to consider innovation capacity and innovation outcomes in a four-quadrant matrix, as in Figure 1. The ideal position is in quadrant one, among the superstar metros (like Nashville) with high capacity and outcomes. These metros have values across all core indexes that are greater than the median metro. Close behind is quadrant two, the emergent metros (like Burlington) that have a high potential for innovation but haven’t “proven it” quite like the superstars have. These metros have higher capacity-heavy core indexes (Human Capital and Economic Well-Being) than the median metro but lower outcomes-heavy core indexes (Business Dynamics and Business Profile) than the median metro. A chasm separates quadrants two and three, the latter of which buck the trend: these metros are counterintuitive in that they have low capacity and high outcomes. Finally, the stragglers have low capacity and low outcomes.
Figure 1: The innovation capacity and outcome quadrant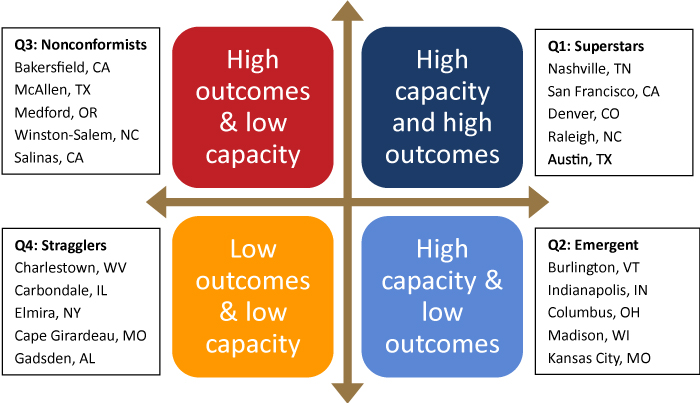
All is not lost for the quadrant three and four metros. These metros need to focus on fostering an environment of innovation and entrepreneurship by increasing educational attainment and human capital, providing resources for startups to grow and thrive, and attracting investment from outside the region, among other things.
The quadrant two metros should focus on continuing to build their innovation ecosystems by leveraging their better-than-most human capital to start businesses, attract investment, patent ideas and raise regional income. The quadrant one metros should keep up the good work but can’t become stagnant: San Francisco, for example, has been under a post-pandemic malaise (tech industry layoffs, too-high cost of living, a struggling downtown office market, etc.) that threatens to dethrone it from superstar status.
Though it may be obvious to some, it must be said that efforts to encourage and enhance innovation in your region must be sensitive to local context. What works in Denver may not work in Carbondale, Illinois, because the places are so different. Stakeholders should build on what makes a region unique or risk their efforts falling flat.