The ACS is an ongoing survey sent to about 3.5 million randomly selected addresses each year. It asks questions about jobs, education, housing, technology use, place of birth, demographics and many more subjects. Planners, nonprofits, businesses and public officials use data from the survey for important decisions like planning for hospitals and schools, business site selection and distributing hundreds of billions of dollars in federal and state funds.
The Census Bureau’s website is the best source of information about the ACS. You’ll find a Q&A, the purpose of each question on the survey, guidebooks in English and Spanish, sample questionnaires and a data user group where you can ask questions and share resources with other ACS users. Finally, data.census.gov is the flagship data site where you can browse and download Census Bureau data, including the ACS.
Users can find ACS data throughout StatsAmerica. The Regional Profiles contain the most ACS data at the most common geographies, including counties, states and cities/towns. On the Anywhere USA profile, we provide data on virtually every geography you can think of—including one that even the Census Bureau doesn’t have: Economic Development Districts.
We also have a few tools that incorporate and add value to ACS data. The Regionizer enables custom region building and aggregates the data for you, while Innovation Intelligence culls data from a variety of sources into topical indexes.
The Davenport-Moline-Rock Island, IA-IL metropolitan statistical area, better known as the Quad Cities, is a major economic hub in northwest Illinois/southeast Iowa. As of 2021, it had a population of 384,055 and is home to several major companies, including John Deere, Von Maur, Rock Island Arsenal and Genesis Health System.1 Suppose a new company is considering moving to the area and is analyzing its educational attainment. They may use Anywhere USA on StatsAmerica to put together a table like Table 1, which shows the education breakdown of the four counties that comprise the region, the region as a whole, Iowa and Illinois.
Table 1: Education attainment breakdown in the Quad Cities metro area, Iowa and Illinois
|
Educational Attainment |
Scott,IA |
Rock Island, IL |
Mercer,IL |
Henry,IL |
Quad Cities |
Iowa |
Illinois |
| Total Population 25 and Older |
118,214 |
99,470 |
11,260 |
34,902 |
263,846 |
2,119,884 |
8,764,878 |
| Less than 9th Grade |
2,378 |
3,730 |
244 |
737 |
7,089 |
58,639 |
399,073 |
| % |
2.0% |
3.7% |
2.2% |
2.1% |
2.7% |
2.8% |
4.6% |
| 9th to 12th, No Diploma |
4,789 |
7,188 |
598 |
1,957 |
14,532 |
84,027 |
458,931 |
| % |
4.1% |
7.2% |
5.3% |
5.6% |
5.5% |
4.0% |
5.2% |
| High School Graduate (includes equiv.) |
32,952 |
29,460 |
4,332 |
12,017 |
78,761 |
646,672 |
2,194,993 |
| % |
27.9% |
29.6% |
38.5% |
34.4% |
29.9% |
30.5% |
25.0% |
| Some College, No Degree |
25,128 |
25,062 |
2,660 |
7,632 |
60,482 |
439,725 |
1,707,785 |
| % |
21.3% |
25.2% |
23.6% |
21.9% |
22.9% |
20.7% |
19.5% |
| Associate Degree |
13,273 |
10,584 |
1,317 |
4,204 |
29,378 |
255,456 |
727,336 |
| % |
11.2% |
10.6% |
11.7% |
12.0% |
11.1% |
12.1% |
8.3% |
| Bachelor's Degree |
25,050 |
14,972 |
1,372 |
5,542 |
46,936 |
441,878 |
1,932,282 |
| % |
21.2% |
15.1% |
12.2% |
15.9% |
17.8% |
20.8% |
22.0% |
| Graduate, Professional or Doctorate Degree |
14,644 |
8,474 |
737 |
2,813 |
26,668 |
210,864 |
1,310,297 |
| % |
12.4% |
8.5% |
6.5% |
8.1% |
10.1% |
9.9% |
14.9% |
Among the counties in the Quad Cities region, Scott County, Iowa, has the educational advantage, with bachelor’s and graduate degree attainment—3.4 and 2.3 percentage points greater, respectively, than the metro overall.
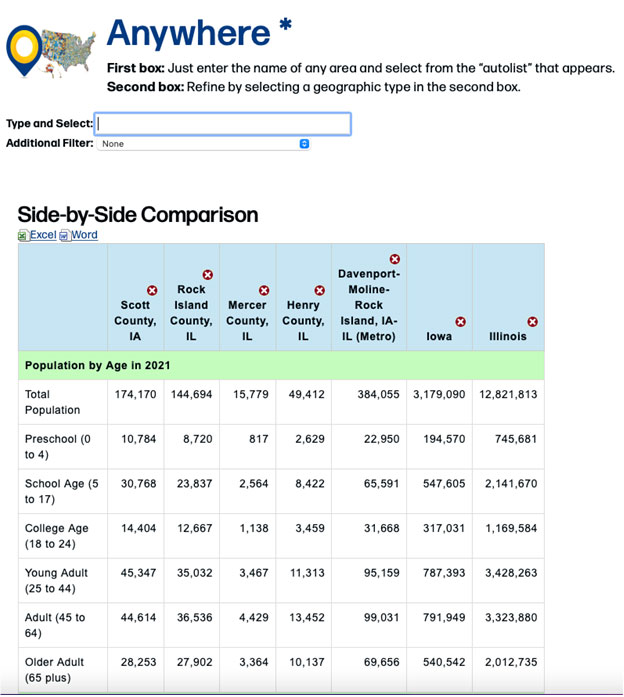
To re-create Table 1, navigate to Anywhere USA and click the “Comparison” tab. Start typing the geographies in the box and select them from the autofill (see Figure 1). You’ll have to scroll a bit to get to the educational attainment section.
Figure 1: Screenshot of Anywhere USA output
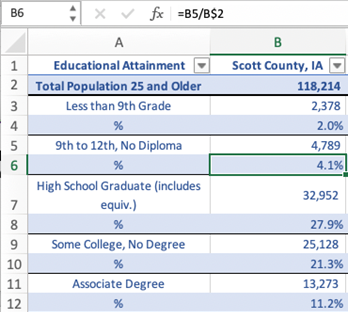
Click the “Excel” link to download the data to an Excel workbook and open the file; you may see an error message about the file format not matching the extension, which you can ignore. It helps to copy and paste the geography names and the educational attainment data (which starts around row 26) to a new sheet. To calculate the percentages, divide each of the educational attainment numbers by the “Total Population 25 and Older” numbers in the first row, as in Figure 2. Use the “$” notation in the formula so you can copy and paste the formula while keeping the “Total Population 25 and Older” number as the denominator.
Figure 2: Percent of population 25+ by educational attainment calculation in Excel
After a little wrangling, you should get a table like Table 1. Perhaps you’d like to delve into Scott County a little further: how does it compare to other counties in the United States? Navigate to Counties in Profile, search for “Scott County, Iowa” and click the “Education” link on the left side of the page. You’ll see that Scott County’s bachelor’s degree attainment of 21.2% is ranked 443rd (out of 3,143 counties in the U.S.). Click the “443” to get a list of all counties in the nation ranked by percent of the population 25+ with a bachelor’s degree and click the “Excel” link to download it.
A common metric used to compare units (e.g., counties, states, students in a class, etc.) is the percentile rank, which is the percentage of values in a distribution that are less than that value. What percentile rank is bachelor’s degree attainment in Scott County? Figure 3 shows you how to calculate it using the PERCENTRANK.INC Excel function.
Figure 3: Percentile rank calculation in Excel
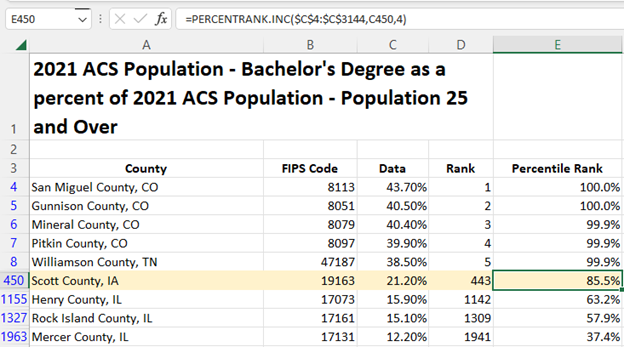
The first argument of PERCENTRANK.INC is the list of data values in column C, the second argument is the value you’re calculating the percentile rank of, and the third (optional) argument is the number of significant digits you’d like to return. According to this calculation, Scott County, Iowa, is in the 86th percentile of counties by bachelor’s degree attainment as a percentage of the population 25 and older. That is considerably better than the other counties in the Quad Cities metro, but still a ways away from the top five counties.
This is simply one example of what can be done with ACS data from StatsAmerica. We encourage you to start exploring the data for your community today.
Notes
-
“Major Employers”, Quad Cities Chamber of Commerce, https://quadcitieschamber.com/economic-development/meet-our-region/largest-employers