User Spotlight
Laila Assanie, Sr. Business Economist, Dallas Federal Reserve

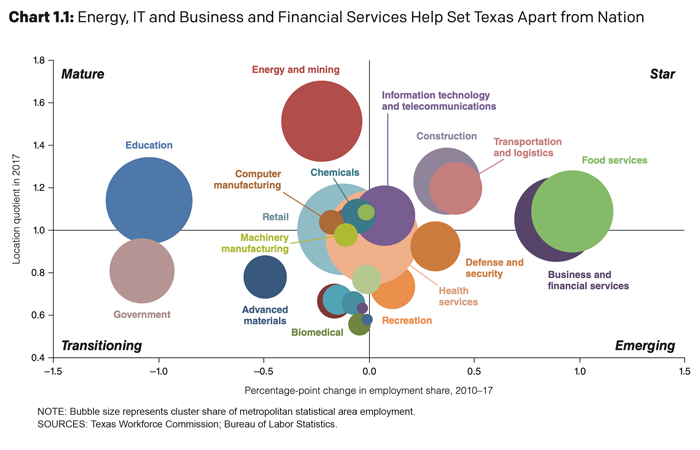
Since 2016, the Dallas Federal Reserve has produced At the Heart of Texas, which focuses on the history, demographics and industry clusters shaping 12 Texas metropolitan areas. The authors identify the dominant clusters—groups of related industries with higher shares of employment than the U.S. average—that drive each metro’s growth. Building on the baseline cluster definitions from StatsAmerica, they find that energy, information technology and business and financial services are the state’s key dominant clusters (see Chart 1.1 from their report below).
In January 2022, we chatted with Laila Assanie, Sr. Business Economist at the Dallas Fed, about how her team modified the StatsAmerica baseline cluster definitions for Texas metros based on their expertise and local knowledge. Responses have been edited for length and clarity.
How did you come to use the cluster definitions on StatsAmerica instead of some other source or creating your own from scratch?
Laila Assanie:
When we initiated the At the Heart of Texas project—a report that examines the industrial and commercial makeup of key metropolitan areas in the state—we deliberated on whether to create our own cluster definitions or utilize ones available from another reliable source. The labor and vetting required of a “new” methodology would have considerably delayed publication and could very well have prompted major subsequent revision when we discovered misclassification issues. We decided it was best to adopt an established set of cluster definitions that were comprehensive, included both vertically and horizontally interrelated industries, were from a well-regarded source, had previously been used in other similar analyses and could be easily replicated and modified for Texas and its metro areas. The cluster definitions from StatsAmerica met all these requirements and provided a dependable framework based on the North American Industrial Classification System (NAICS) for us to adapt for our analysis.
In the analysis of Texas cities, you combined, broke up, removed, and even created some clusters. Describe how you customized the clusters for the analysis. What factors informed your alterations of the benchmark definitions?
While the StatsAmerica cluster definitions provided us with a comprehensive and robust framework of interconnected upstream and downstream industries down to the six-digit NAICS level, we felt the original 17 clusters and six manufacturing subclusters, which were primarily traded or export-oriented clusters, left out some key industries such as retail and construction that were an instrumental part of the Texas economic engine. In other cases, it was useful for us to provide more attention to areas that were characterized broadly; for example, “education” was one such category that was originally included under “government.” Moreover, data for more granular NAICS codes were limited due to confidentiality restrictions, particularly for smaller-sized metros. Hence, we modified some of StatsAmerica’s benchmark cluster definitions and included additional clusters to capture a more complete view of Texas and its metro areas.
Were there any unexpected or surprising findings that came out of the Heart of Texas report? If so, what are they?
There certainly were some striking findings from the report. Most notably, we recognized that every metro area had a unique footprint, and regardless of its size, each one had a specialty that was often rooted in its history and influenced by its geographic location and geological and demographic makeup. For instance, Midland-Odessa’s economy has been closely tied to the energy and mining industries since the 1920s. These sectors still have an outsized presence today, with the energy and mining cluster employing nearly a third of the metro’s workforce, and it is five times more concentrated in the metro relative to the U.S. Another finding was that small-sized metros often develop their economic prowess by drawing upon the strengths of the mega cities close by—Beaumont-Port Arthur from Houston and Tyler-Longview from Dallas, for example.
What other data sites do you recommend?
The US Cluster Mapping portal provides valuable resources, including relevant research, data sets, and inclusive cluster definitions that can be applied at multiple geographic levels to identify and analyze the key clusters driving local economies. We use data from a wide variety of government and private sources in our work. Since the onset of the pandemic, we have used multiple data sets from various sources such as Opportunity Insights’ Economic Tracker and the Census Bureau’s Pulse Surveys to gauge the impact of the pandemic on the health of the U.S., state and local economies.
What is some advice you have for organizations looking to conduct a similar cluster analysis for their region(s)?
First and foremost, contact your local workforce commission agency as they will be able to address most of your data related queries. Because Texas is huge, we can perhaps more easily than other researchers consider our metros solely within the context of the state. Others attempting this kind of project may want to include measures or references to incorporate nearby metros in adjacent states whose commercial activity draws on target state communities. Use a reliable and established source for the cluster definitions; there’s no need to reinvent the wheel. Be flexible in the process so that you can tweak classifications as necessary. Automate as much as possible, and finally, pack a lot of patience as you will surely need it.