Guides for StatsAmerica
Investment Strategies with StatsAmerica
Introduction
The data and tools on StatsAmerica can be used to help answer a variety of community investment questions. What types of jobs and industries are common near my community? What are the characteristics of the workforce? Do workers have the education necessary to fill high-tech jobs? What clusters are dominant in my community? This guide will present some strategies, while utilizing the data and tools available on StatsAmerica, for making economic development investments in your community.
Business attraction and site selection
The Big Radius Tool is a simple but powerful tool that presents a data report based on a 25- to 500-mile radius from a geography you select. It’s a quick and easy way to summarize the demographic and workforce characteristics of an area without restricting you to a single county or city. This can be informative for business attraction or site selection because private enterprise isn’t concerned with the political boundaries that so often constrain data selection. They want to know what the workforce is like around a potential site location—25 miles, 50 miles, etc.—which shouldn’t be limited to within the city or county.
Figure 1: A 25-mile radius report for Indianapolis, IN
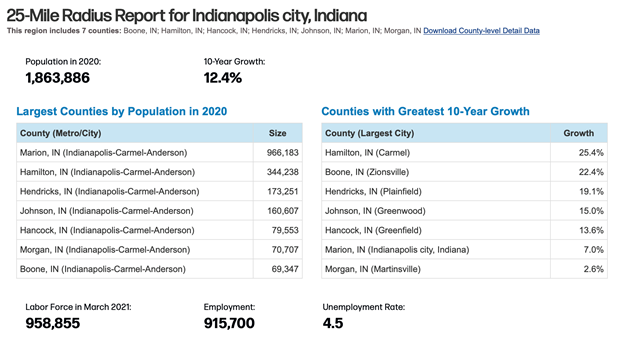
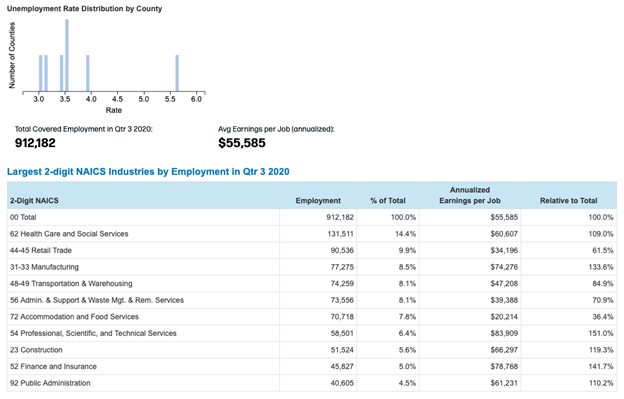
Source: Big Radius Tool
Perhaps a manufacturing firm is targeting the Indianapolis area for expansion. A report like above, as well as the expanded county-level data you can access by clicking the “Download County-level Detail Data” link in Figure 1, can shed some light into the workforce of the 25-mile radius as a whole and the individual counties within it. Since manufacturing is so prevalent in this area—almost 9% of the workforce—the area seems to have the workforce capacity for a new manufacturing firm.
Opportunity zones
Enacted in 2017, the federal Opportunity Zones (OZ) program is intended to foster economic development in disadvantaged areas by providing tax advantages to investments made in these areas. Communities have begun incorporating OZs into regional plans like the Comprehensive Economic Development Strategy (CEDS) and are actively marketing the zones to investors. In 2020, we partnered with the U.S. Economic Development Administration (EDA) to develop the Opportunity Zone Mapping Tool. The tool presents data about the population living in OZs and allows users to evaluate OZs in their region in the context of other federal programs, like Economic Development Districts (EDDs), University Centers and Revolving Loan Funds.
One use of the tool is for marketing the OZs in your service area to potential investors. We provide a variety of geographies to suit the needs of different audiences, including counties, congressional districts, EDDs, states and EDA regions.
Figure 3: Partial Opportunity Zone report for Tract 3 in Grand County, UT
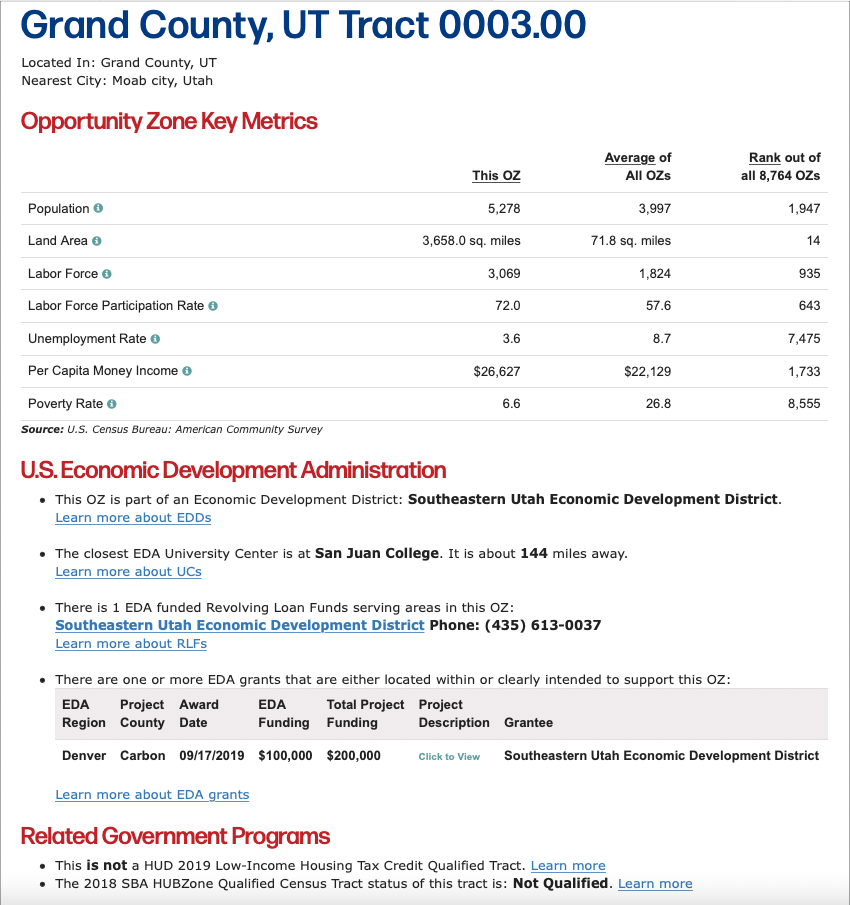
Source: USA Opportunity Zone Mapping Tool
For example, the table above could be incorporated into a marketing plan for Grand County to show investors some key facts about the OZ so they can decide whether it may be a worthwhile investment. The explicit linkage between OZs and other programs at EDA and other agencies gives users an idea of the extent to which a tract has attracted federal investment or is eligible for certain kinds of government programs, which may be important for some investors. For example, a real estate investor may want to know whether the tract is qualified for low-income housing tax credits. When there is competition for investment, the intersection of OZs with other federal programs may be just the thing to tip the scales in favor of one place over another, so it’s in communities’ best interests to make would-be investors aware of these opportunities.