Guides for StatsAmerica
How can University Centers use StatsAmerica?
Introduction
“University Centers collaborate with other EDA partners, such as Economic Development Districts (EDDs), by providing expertise, applied research, and technical assistance to develop, implement, and support regional strategies that result in job creation, high-skilled regional talent pools, and business expansion in a region’s innovation clusters. UCs focus on one or more of the following areas: regional commercialization efforts, advancing high-growth entrepreneurship, cultivating innovation, encouraging business expansion in a region’s innovation cluster, developing a highly skilled regional workforce, or increasing the resiliency of a region.”
Source: U.S. EDA University Center Program
The EDA University Center (UC) program is intended to leverage the capacities of academic institutions to support entrepreneurship, resilience and inclusive economic prosperity for their regions by providing technical assistance to community economic developers. StatsAmerica has helpful tools and data to facilitate this work, including our profiles and Innovation Intelligence. These tools can be used to find data on a community for various aspects, like demographics, income and wages, education, workforce, and innovation. Regardless of the focus area of a particular UC, StatsAmerica can provide the data it needs to make informed decisions to facilitate economic development in its region.
Regional Profiles
The regional profiles—Counties in Profile, Towns in Profile, States in Profile and Anywhere USA—provide a baseline understanding of the region of study, whether your goals are to support an emergent industry cluster, develop workforce skills or improve economic resiliency. The data on the profiles should augment, but not replace, on-the-ground knowledge about the region, which should be gathered by engaging with the partner organization early and often.
Innovation Intelligence
The Innovation Intelligence Tool provides information on a region’s innovative output and capacity for innovation. It does this by combining a wealth of data centered on innovation, entrepreneurship, human capital, the business environment and the workforce into easy-to-understand indexes. The indexes are easier to interpret because the source data have different scales. This means we can combine percentages, rates, counts, etc. into at-a-glance indexes that present lots of complex information succinctly and can be used for comparisons.
Innovation Intelligence relates to the primary focus area of many UCs: fostering an environment of innovation and entrepreneurship. UCs can use the tool to get a sense of the region’s innovation capacity and consider what strategies are realistic given its human capital constraints. For example, a region with a low index value for Human Capital and Knowledge Creation—which includes variables relating to educational attainment, STEM degrees creation and population growth—may not have the capacity to grow a high-tech industry cluster. These jobs often require advanced degrees, so the region may need to pursue strategies to increase educational attainment, or encourage in-migration of well-educated residents, before it can do so.
Figure 1 is the headline Innovation Intelligence Index for Peoria County, IL. The summary value of the county’s overall innovation capacity shows that Peoria County is slightly ahead of the curve relative to other counties: out of 3,110 counties, it’s ranked 808.
Figure 1: Headline Innovation Intelligence Index for Peoria County, IL
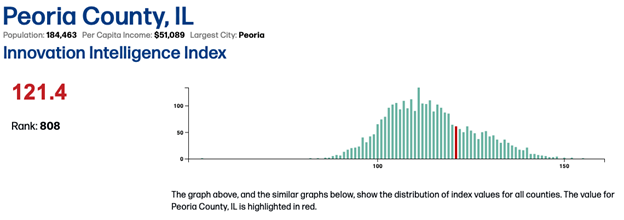
Source: Innovation Intelligence
Figure 2 shows each of the core indexes that make up the headline index. The indexes and ranks give an idea of what the county’s strengths and weaknesses are, while the key takeaways provide some context.
Figure 2: Core indexes for Peoria County, IL
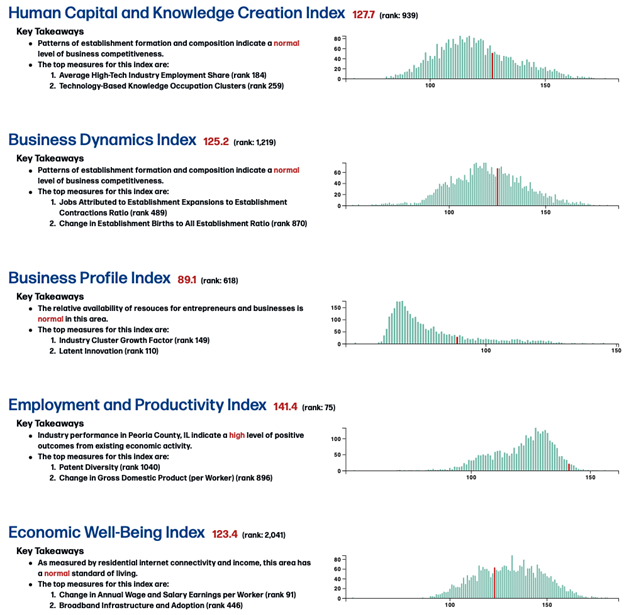
Source: Innovation Intelligence
Figure 3 is a partial comparison table that shows how the components of the Human Capital and Knowledge Creation core index compare to other counties. You can add as many counties as you wish and download the data in Excel for further analysis.
Figure 3: Innovation Intelligence Index comparison for the Human Capital and Knowledge Creation core index
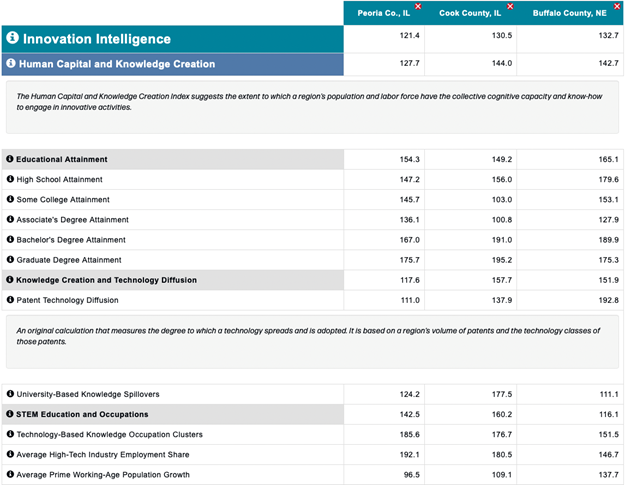
Source: Innovation Intelligence