About USA Counties in Profile
These profiles provide a select compilation of demographic and economic indicators.
They are updated periodically through the year, so check back often for the most current information. Note: We focus on counties because that is the geographic level for
which we can get current data. The point is to provide access to annual indicators for as small an area as possible. That is the county.
To learn more about the data, the ranks and other
features, click on a heading below to expand/collapse its content:.
For space reasons, sources were not cited on the overview page as they are with the other tables. They are provided below.
- Population
and Households
Source: U.S. Census Bureau
- Labor
Force: the number of persons, by county of residence, who
are either employed
or unemployed and seeking work. Annual average.
Source: U.S. Bureau of Labor Statistics.
- Unemployment
Rate: annual average.
Source: U.S. Bureau of Labor Statistics.
- Per
Capita Personal Income: This measure of income is calculated
as the personal income of the residents of a given area divided
by the resident population of the area.
Source: U.S. Bureau of Economic Analysis.
- Median
Household Income: annual estimate.
Source: U.S. Census Bureau. - Poverty
Rate: annual
estimate.
Source: U.S. Census Bureau. - High School
Diploma or More and Bachelor's Degree or More
Source: U.S. Census Bureau
- Covered
Employment: annual averages based on covered payroll counts
(QCEW).
Source: U.S. Bureau of Labor Statistics.
- Average
Wage Per Job: covered payroll divided by covered employment.
Source: U.S. Bureau of Labor Statistics.
- Manufacturing
- Percent of all jobs: Calculated by dividing manufacturing jobs
for the county
or state by the total number of nonfarm jobs. The percentage
given reflects the proportion
of all jobs in the county or state that are in the manufacturing
sector.
- Transportation
and Warehousing - Percent of all jobs: Calculated by dividing
transportation and warehousing for the county or state by the
total number of nonfarm jobs. The percentage given reflects
the proportion of all
jobs in the county or state that are in the transportation and
warehousing sector.
- Health Care and Social Assistance - Percent of all jobs: Calculated by dividing health care and social assistance jobs for the county or state by the total number of nonfarm jobs. The percentage given reflects the proportion of all jobs in the county or state that are in the health care and social assistance sector.
- Finance
and Insurance - Percent of all jobs: Calculated by dividing
finance and insurance jobs for the county or state by the total
number of nonfarm jobs. The percentage given reflects the
proportion of all jobs in the county or state that are in the
finance and insurance sector.
POPULATION
- Population Over Time: 1980 data are using July 1 estimates. The other decades are Census counts as of April 1.
- Components of Change: Part of the annual county estimates of the resident population. Further explanation of this and the estimates methodology can be found at http://www.census.gov/popest/.
- Population by Age: Between Census years this section is updated with age estimates. The median age for age estimates was calculated by the IBRC. The Census Bureau states that due to the complexities associated with the production of detailed characteristics estimates at the state and county levels, the values of the estimates at lower levels of geography may not necessarily sum to estimates at higher levels of geography. In addition, further complications arise when producing characteristics estimates for the District of Columbia. Due to its unique status, the population total presented here is the sum of the characteristics for the District of Columbia and does not match the official population total previously released.
- Population by Race: Census 2000 was the first census to allow for multiple choices on the race question. The profile shows those reporting one race only for specific race categories, plus the number of persons reporting more than one race.
- Hispanic or Latino (can be of any race): Specifics are provided as to the nationality given by the respondents to this census question. "Other" includes people who do not identify with one of the specific origins, (Mexican, Cuban, Puerto Rican), listed on the questionnaire but indicate that they are ‘‘other Spanish, Hispanic, or Latino’’ are those whose origins are from Spain, the Spanish-speaking countries of Central or South America, the Dominican Republic, or people identifying themselves generally as Spanish, Spanish-American, Hispanic, Hispano, Latino, and so on. Further explantion on Hispanic origin and race being two distinct concepts: http://www.census.gov/population/www/socdemo/compraceho.html.
HOUSING AND HOUSEHOLDS
- Households and Families: A household can consist of one or more persons, regardless of the relationship. Family households must include at least two people related by marriage, birth, or adoption. For example, sisters, cousins, mother and father with children, a grandmother and her grandchildren.
- Residential Building Permits: These data are based on data from 19,000 permit-issuing places across the country. Reports are provided to the U.S. Census Bureau. Further detail can be found at: http://www.census.gov/const/www/newresconstdoc.html
INCOME
- Median Household Income: Median household income is from the decennial census and should not be confused with either the Small Area Income and Poverty Estimates (SAIPE) of the Census Bureau or the low-to-moderate income estimates from HUD (Housing and Urban Development). This profile uses Census data in Census years (example 1990, 2000) and SAIPE data, when available, in non-census years. More information about median household income estimates can be found here: http://www.census.gov/hhes/www/income/income.html
- Per Capita Personal Income: These are annual estimates from the U.S. Bureau of Economic Analysis, which produces a detailed series on personal income, a commonly used measure of wealth that allows for easy comparison among counties and states. Previous years have been adjusted for inflation using the Consumer Price Index.
- Personal Income:
The table shows how personal income is derived:
- Earnings by Place of Work
- Minus contributions to social insurance
- Plus residence adjustment
- Equals Net Earnings by Place of Residence
- Plus Dividends, Rent and Interest
- Plus Transfer Payments
- Equals Total Personal Income by Place of Residence
- Poverty Estimates: The U.S.A. Counties in Profile uses Census data in Census years (example 1990, 2000) and Small Area Income and Poverty Estimates (SAIPE) data, when available, in non-census years. More information about poverty estimates can be found here: http://www.census.gov/hhes/www/income/income.html
LABOR FORCE
More information on labor force data: http://www.bls.gov/lau/laufaq.htm
- Educational Attainment: Refers to the highest level of education completed in terms of the highest degree or the highest level of schooling completed.
- Commuting: Commuting flow data are no longer collected as part of the decennial census.
BLS EMPLOYMENT AND WAGES
Data comes from the Quarterly Census of Employment and Wage Program of the Bureau of Labor Statistics. More information on this data set can be found here: http://www.bls.gov/cew/cewfaq.htm.
BEA
EMPLOYMENT AND EARNINGS
More
information on each line item: http://www.bea.gov/regional/index.htm.
Two ranks are provided—rank within the United States and rank within the state. There is a toggle in the top frame "compare within" that allows the user to switch between U.S. comparisons and comparisons within the state.
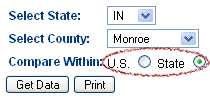
Ranks within State
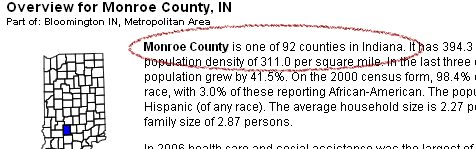
The overview page gives the number of counties in the state if you have clicked state comparison option. Example:
Ranks within the United States
Three things can affect the ranks for a given data item:
-
Each data source (Census Bureau, Bureau of Labor Statistics, etc.) has a few slight variations regarding their set of counties.
-
Tied ranks (for data items that are identical, such as unemployment rates where there isn’t as much variation between counties.
-
Disclosure issues: some data for employment, earnings and wages may not be disclosed (D) to avoid breeching confidentiality rules.
Therefore, the number of counties actually ranked for each item varies.
This profile contains three useful tools
- City-to-County Finder: Type in a city and this tool will tell you the county where it's located.
- Find By Value: This is an advanced option that helps you find peers on criteria you specify.
- Radius Region Builder: This tool calculates certain statistics for counties within a radius that you specify.
And don't forget the County/Metros Side-by-Side, which allows you to compare up to four areas across the nation in a single query.
A variety of calculations are provided as a value-added feature, helping put the data into context. Percent changes, distributions and shares of United States or individual state can help the user understand the specific county’s position nationally or statewide.
Percent changes provide look at change over a given period of time. The earlier year is subtracted from the latest year, divided by the earlier year and presented in percent (rather than fraction) form in this profile.
Percent of U.S. or State (sometimes referred to as share) is a way of comparing the county to the U.S. or its state. For example, the state of Illinois has 4% of the nation’s population. The percent of U.S. or State when calculated based on per capita or rate can be used as a relative measure and show whether the county is doing worse, better or the same as the U.S. or State. For example, Illinois as a percent of U.S. per capita income is 109.1%. This means that Illinois’s per capita income is 9.1% greater than that of the U.S.
Percent within County is a percent distribution calculation—that is, the percent of married couples households as a percent of all households.
Adjustment for inflation was made on all dollar values. This was done using the CPI (consumer price index) for the years being compared.
For counties or county equivalents, we are using the Census Bureau’s latest list of counties (as part of its latest population estimates files). County equivalents are essentially independent cities, such as St. Louis City (which is not part of St. Louis County) or Baltimore City, again, not part of Baltimore County. In Alaska, there are boroughs that are considered equivalents.The BEA (Bureau of Economic Analysis) employment and earnings data have an added set of special geography. That agency has incorporated certain independent cities into counties so that they could show data for those areas.
Here are some additional resources you may find useful:
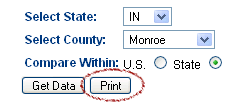
Want to print what you see in the profile? Of course you do, in some cases. Keep in mind that we are using frames.
1. Be sure to use the PRINT button we provide, since what you want is the data below the selection frame.
2. If you want the entire profile, noticed the quiet little “All” at the right hand end of the topic bar. Click on that and you’ll get the entire profile. Then hit the print button we provide and off you go.
![]()
3. Where did the shading go? If you are printing in black and white, and depending on the resolution of your printer, you may not get the shading. If you have a color printer, use that.